The numbers that show the true extent of Mercedes’ dominance

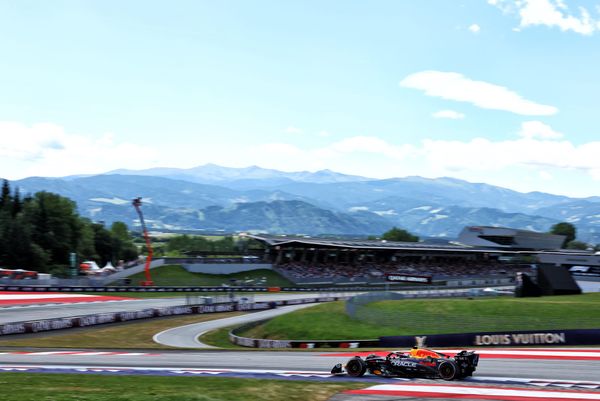
Silverstone was one of those tracks where you could compromise on downforce and still put in a good lap time, but Barcelona is very different.
Yes, you need the top speed but the compromise is not quite as simple because of the final sector. And, as always, the team that’s in the position to be the most uncompromising of all is also the fastest: Mercedes.
That last sector, which starts just before the braking zone for the Turn 10 hairpin, contains seven corners. Five of these are major traction events, so to keep the tyres alive, especially the rears, for that section of the track requires more downforce than you need through the long fast corners.

As drivers within the same team might just run slightly different downforce set-ups, I have taken the fastest driver from each team that reached Q3, in effect just looking at the chassis. This is converted into a percentage, with the same treatment given to the three sector times and the four speed traps
The reason only to look at the teams that reached Q3 is that Lewis Hamilton’s lap time improved in each session, so looking at this we don’t really know what is track improvement and what is actually chassis, power unit or driver improvement. We will come onto that further down.
A negative on speed means that you are slower than Hamilton, a plus on lap or section time means that you are slower than Hamilton.
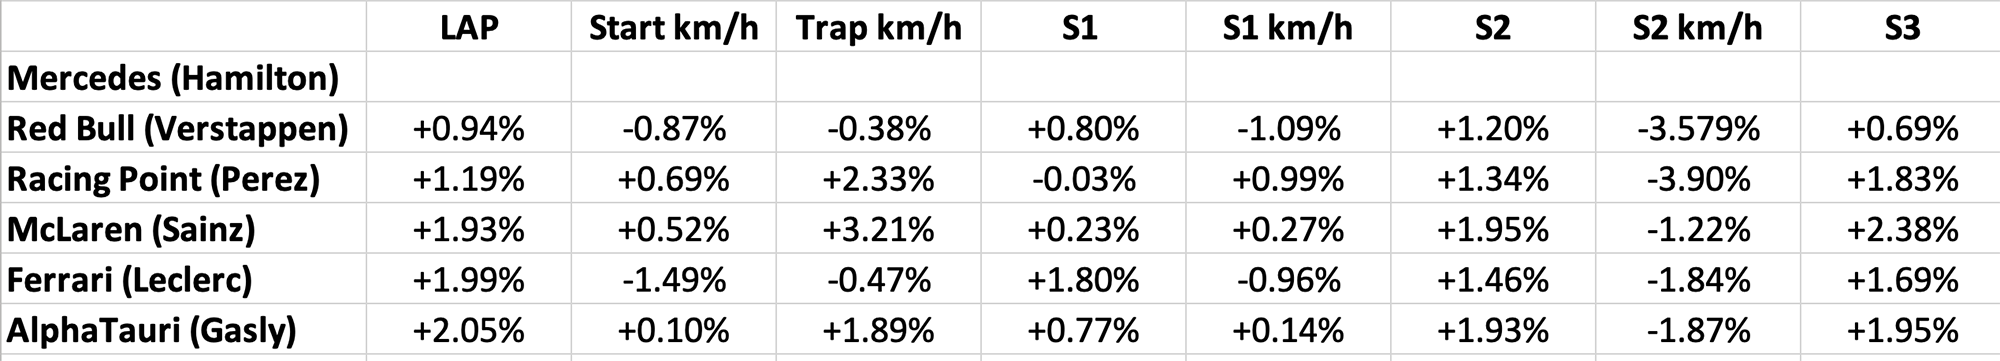
Given the Mercedes isn’t the strongest in speed traps, we can assume that it’s carrying more downforce than the rest.
While this isn’t a surprise given we know how good that car is, it is also something you can do if you have a pace advantage – helped by having a strong engine with a good qualifying mode.
Remember all of those times Sebastian Vettel and Red Bull were in the lower reaches of the speed traps but ran into the distance in the race?

Given Mercedes will start first and second and doesn’t have to worry so much about pressure from behind, it can maximise the downforce – just as Red Bull used to in its heyday.
This has the added advantage of protecting the tyres in qualifying as you aren’t sliding around so much, so you will be even stronger at the end of the lap – particularly out of the chicane.
Now we can have a look at session improvement, again in percentage terms for the fastest overall driver for each team and referencing their time to the fastest for each segment of qualifying. Surprise, surprise, it’s Hamilton at the top again.
| Q1 | Q2 | Q3 | |
| Mercedes (Hamilton) | |||
| Red Bull (Verstappen) | +0.444% | +0.664% | +0.937% |
| Racing Point (Perez) | +0.319% | +0.859% | +1.188% |
| McLaren (Sainz) | +0.736% | +1.135% | +1.932% |
| Ferrari (Leclerc) | +0.500% | +1.237% | +1.989% |
| AlphaTauri (Gasly) | +0.630% | +1.035% | +2.053% |
| Renault (Ricciardo) | +1.034% | +1.559% | |
| Alfa Romeo (Raikkonen) | +1.203% | +1.806% | |
| Haas (Magnussen) | +1.348% | ||
| Williams (Russell) | +1.596% |
Looking at these session percentages, it’s easy to see the increasing deficit to the works Mercedes of Hamilton as the sessions go on.
Teams fighting to get out of Q1, for example Williams with the same Mercedes engine the works team has, will be using everything they have. It’ll be the same for those battling to make it to Q3.

But you can clearly see the slippery slope the teams that get through to Q3 are on as Mercedes just has the advantage and it simply gets bigger.
We can also compare the overall performance order to what we had in testing at the same circuit.
As expected, the gap from front to back is over twice what we saw from the fastest times here in February.
Below, we can see Mercedes at the top as usual, then the rest of the teams ranked in terms of the difference from their testing gap to the gap in qualifying today.
| TESTING | QUALIFYING | DELTA | |
| Mercedes | |||
| Williams | +1.503% | +3.327% | +1.825% |
| Renault | +0.718% | +2.135% | +1.417% |
| Haas | +1.712% | +3.075% | +1.363% |
| Ferrari | +0.829% | +1.989% | +1.160% |
| AlphaTauri | +1.560% | +2.384% | +0.788% |
| McLaren | +1.436% | +1.932% | +0.469% |
| Alfa Romeo | +1.597% | +2.053% | +0.456% |
| Red Bull | +0.709% | +0.937% | +0.228% |
| Racing Point | +1.222% | +1.188% | -0.034% |
Williams and Renault are the biggest losers, dropping 1.825% and 1.417% off Mercedes compared to the headline times in testing.
Only one team has got any closer, and that’s Racing Point with a gain of just 0.034% that doesn’t amount to much.
Every way you look at it, Mercedes is on top.