Gary Anderson assesses modern F1’s most dominant teams

The way Red Bull’s started the 2023 Formula 1 season has made people talk about the possibility of it dominating the whole year, maybe winning every single grand prix. Lewis Hamilton’s even suggested this year’s Red Bull’s got a bigger speed advantage than any of his championship-winning Mercedes cars ever had.
But as those Mercedes championship years proved, one team dominating really isn’t unusual in F1. If we’re going into a Red Bull era now, it’s coming soon after a Mercedes era, which toppled a different Red Bull era, which came not too many years after a Ferrari era.

People often try to compare those and draw conclusions over what the ‘most dominant’ team, car or driver was. It’s always very difficult to really know what brings together a successful season, and what percentage has been the car compared to the driver.
Whenever we see a truly exceptional dominant performance, we end up talking about how much of the success is just down to the car. But should we just talk about the number of wins, or look at what the lead driver has done as the ultimate potential of the car – or factor in the ‘number two’ driver’s performances a bit more? And should the quality of the opposition affect how we judge the dominant team? Did the most dominant performances happen as much because the other big teams all got things really wrong as because the champion team did things right?
To look at this a little bit deeper I have put together some numbers covering 2000 up until the end of 2022.
I picked this period because I feel that F1 became much more professional since the turn of the century with increased investment allowing the teams to build their structures considerably and improving the tools used to design and research the cars. For instance, driver-in-the-loop simulators brought increased understanding of how to get the best performance out of the cars.
That’s not to say that it was impossible to build a dominant F1 car before this, and there were quite a few occasions when it happened.
The most famous example was McLaren winning 15 of 16 races in 1988 (94%), in a car designed by someone I have always looked up to: Gordon Murray.
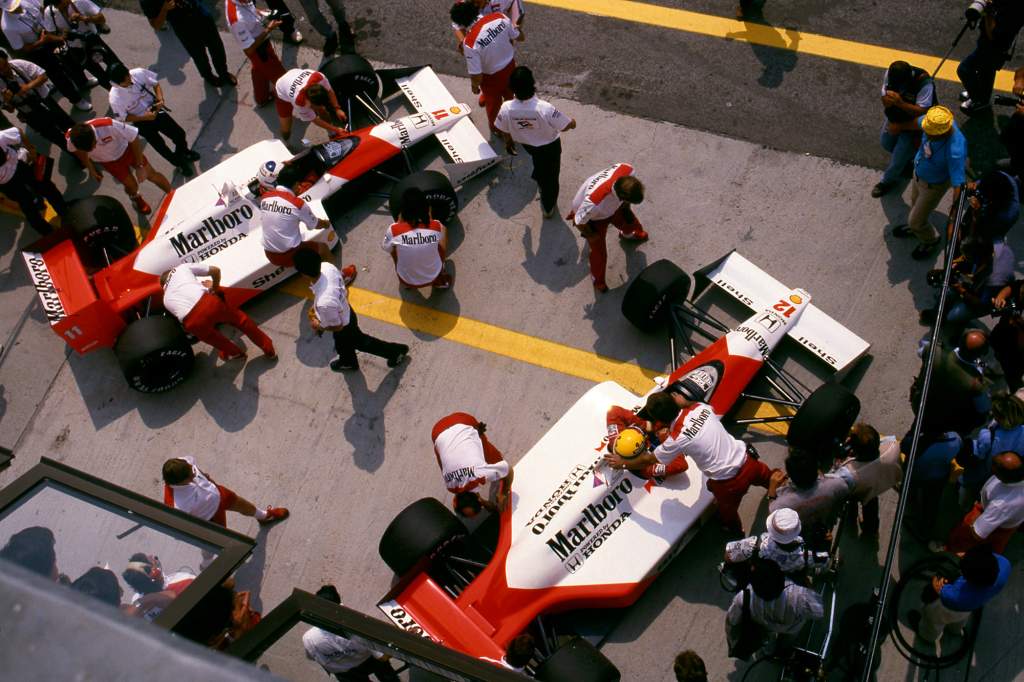
Ayrton Senna took eight of those wins (50%) and Alain Prost took seven (44%) with the only intruder during the season being Gerhard Berger in his Ferrari – strangely enough at Monza, but only because Senna tangled with a backmarker. What a driver pairing Senna and Prost were, both very different in how they went about their jobs but both knowing how to win.
But looking at the 21st century seasons is a better window of time to consider single-team domination in F1.
The baselines have kept changing – different (normally increasing) amounts of races per season, different points allocations. So to create a level playing field for the statistics I’m putting everything into percentages.
Teams with best winning records
Let’s look first at the sheer percentage of race wins a team has taken in a season, and how they were split between its drivers.
Here’s the top five team performances by this measure from 2000-2022. Bear in mind Senna, Prost and McLaren’s 94% from 1988 still beats them all. For Red Bull to top the 2000s table, it would need to win 21 of this year’s 23 races (91.3%). To beat that 1988 McLaren record, Red Bull would require 22 wins from 23 (95.7%).
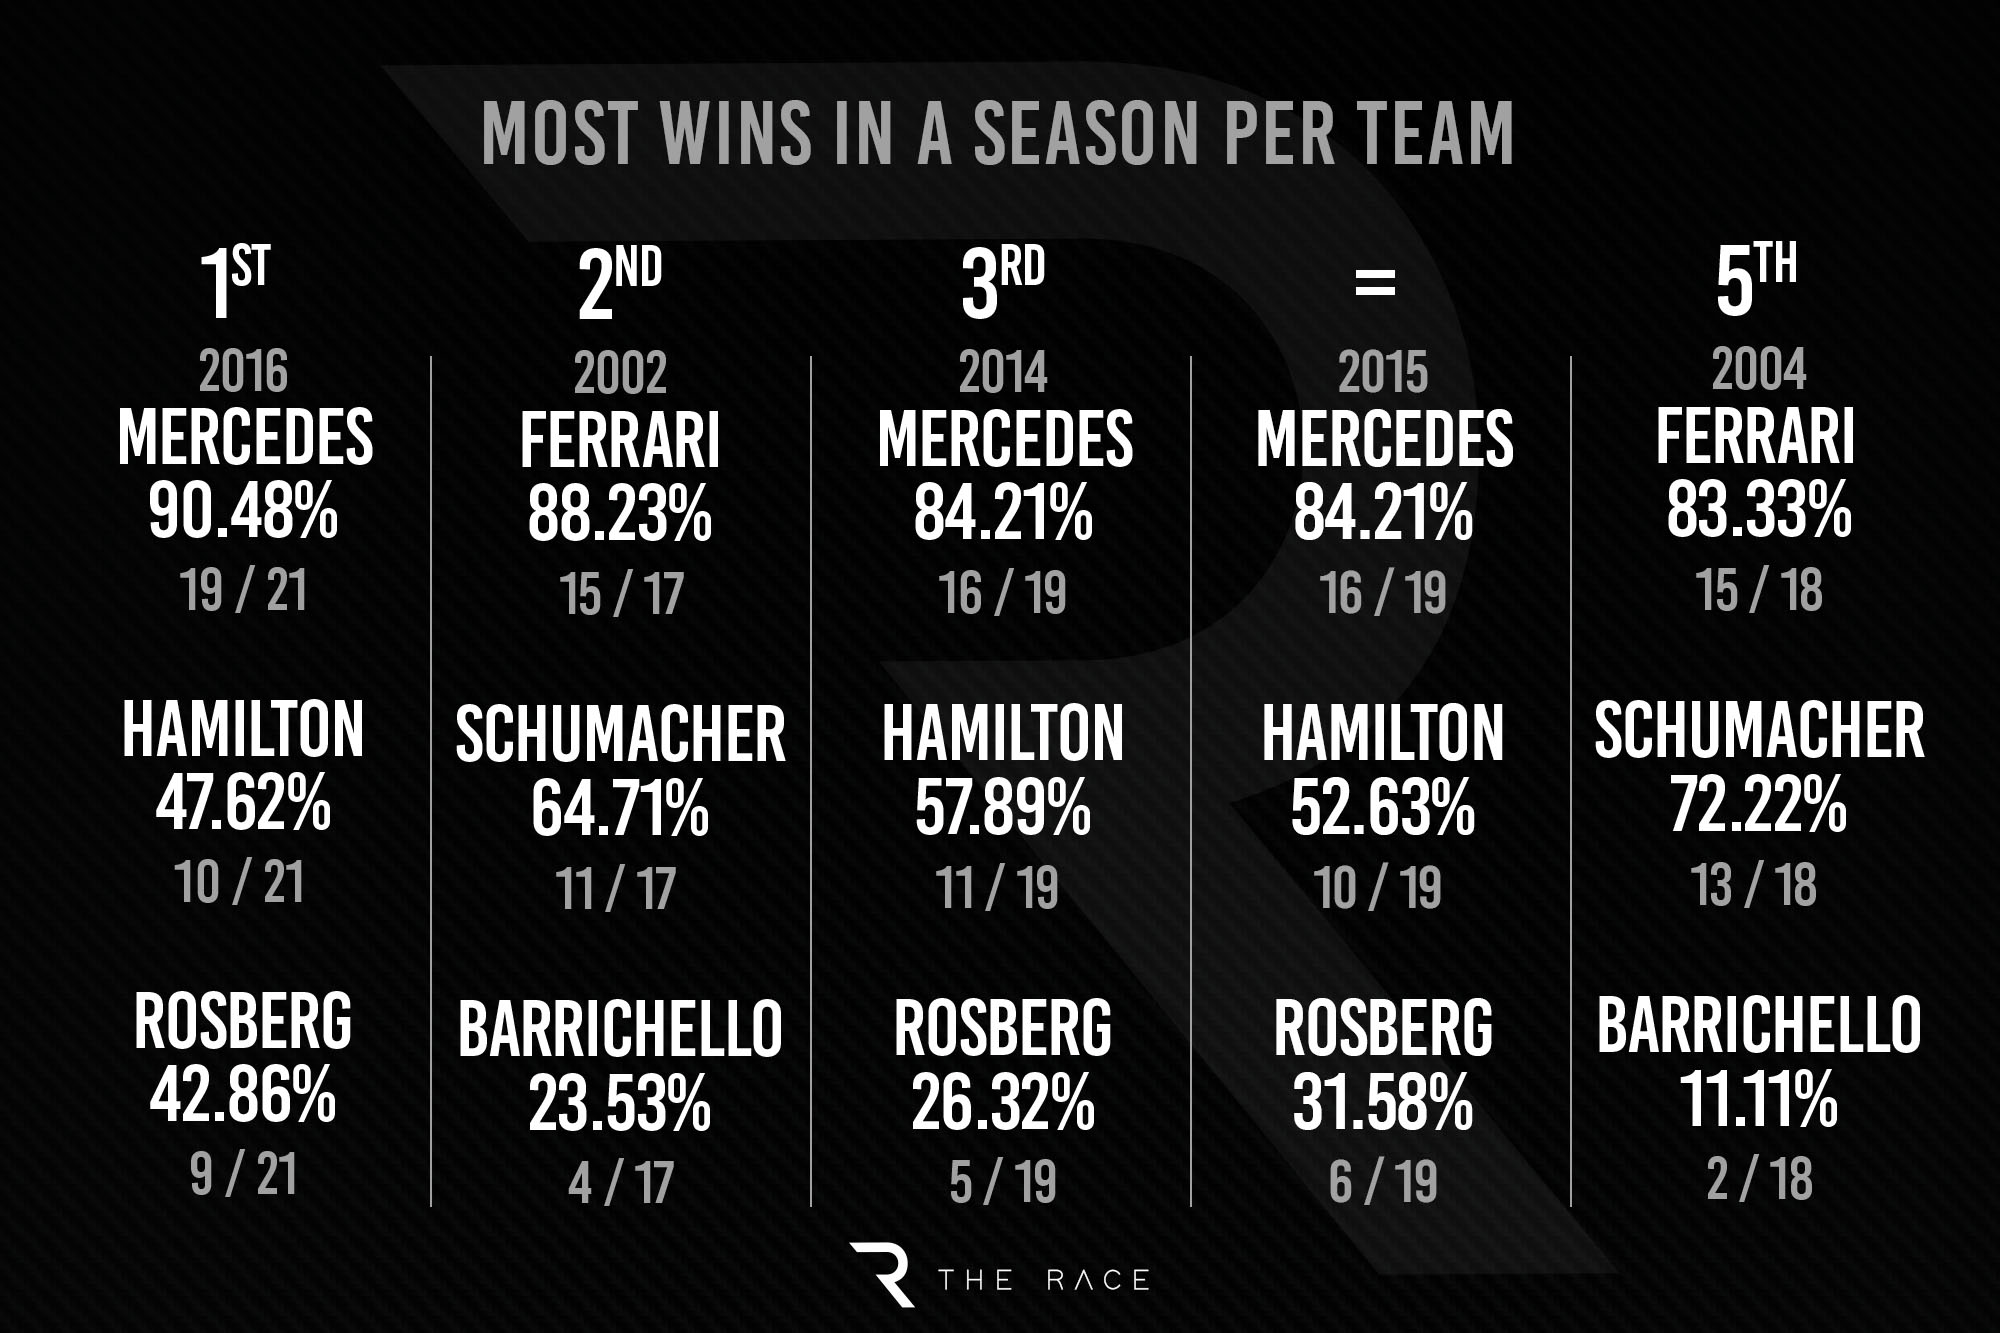
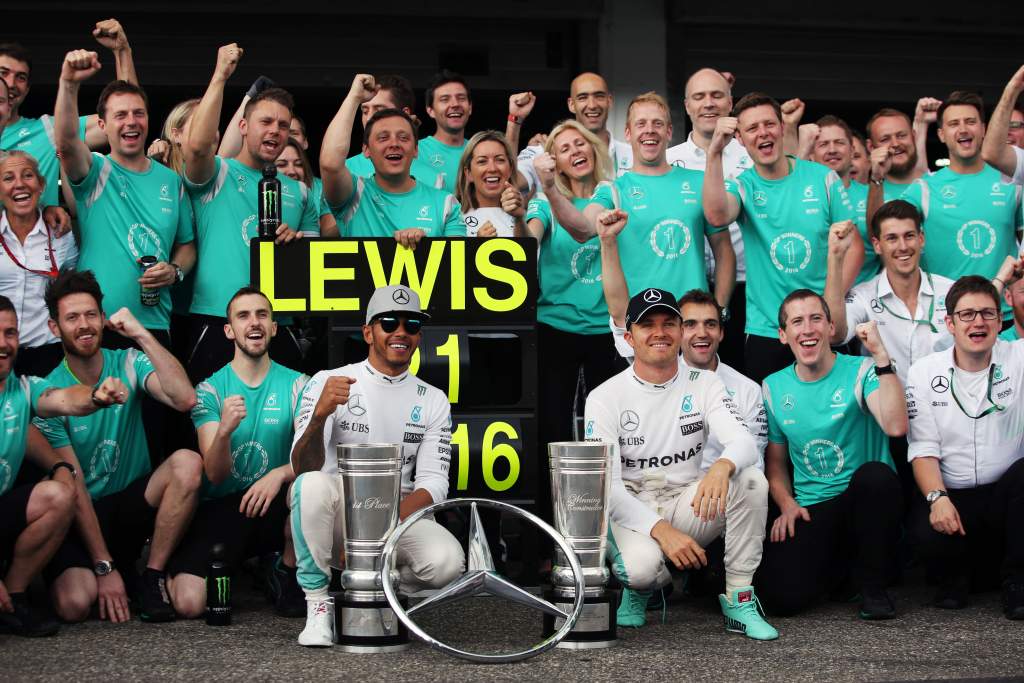
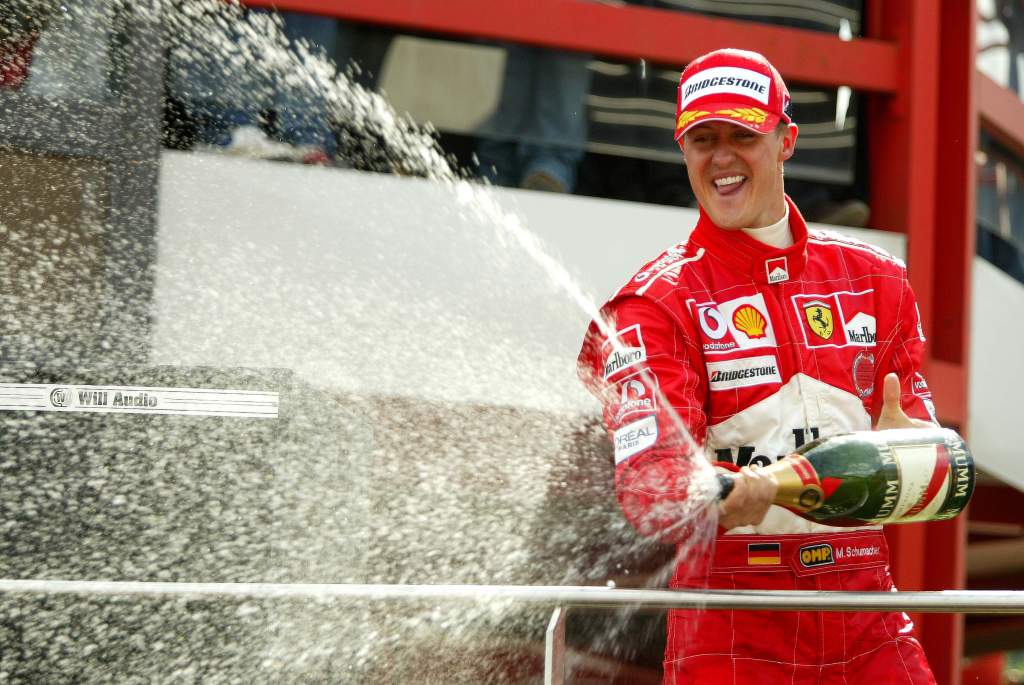
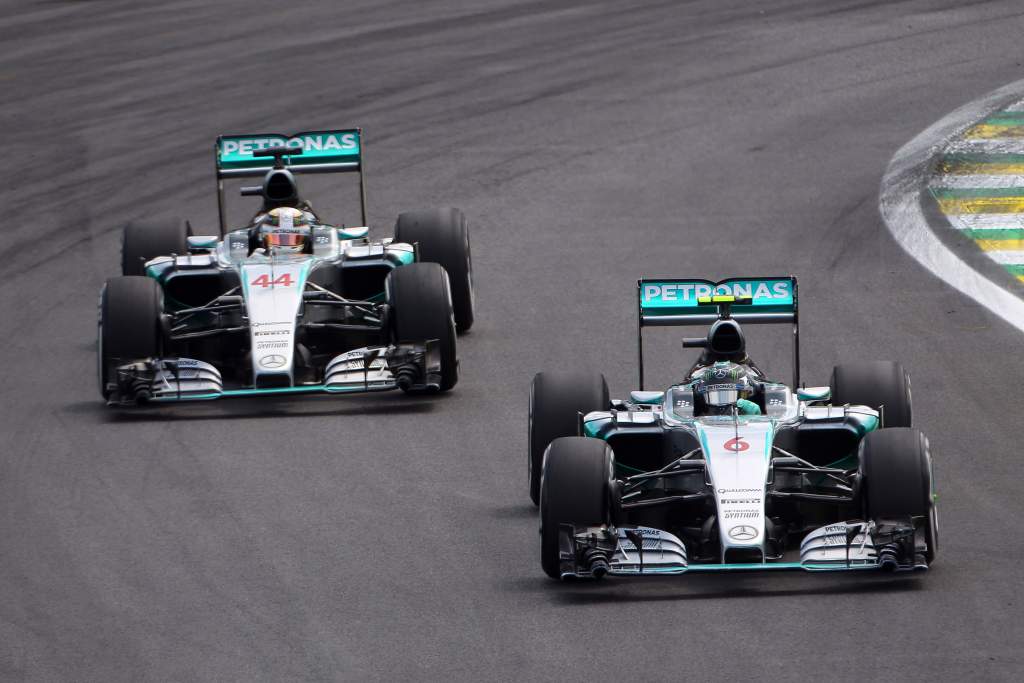
To get win percentages that high obviously means you have a very good car. As you can see, the Mercedes wins were fairly evenly split between its two drivers Lewis Hamilton and Nico Rosberg in 2016. That’s a bit deceptive – this was a year when reliability problems affected Hamilton more heavily. But even in 2014 and 2015, the gap between Hamilton and Rosberg’s statistics is still smaller than it was between Michael Schumacher and Rubens Barrichello in Ferrari’s 2002 and 2004 dominant seasons.

That shows Mercedes managed to make a car that suited both its drivers well, but also Schumacher really did dominate all his team-mates. Yes, Ferrari made him its clear number one driver, but it did that for a reason. To me, these statistics show that – relatively speaking – the car contributed more to the drivers’ success in those Mercedes years than in Ferrari’s dominant seasons because Schumacher managed to elevate the Ferrari that little bit more.
I’m pretty sure Bridgestone was a major contributor to Ferrari’s dominant years, too. We used Bridgestone tyres at Jordan during that period but I can assure you they were not the same tyre as Ferrari used. That ‘works’ relationship helped Ferrari both when Bridgestone had the edge over Michelin, and beyond that because Michelin was trying to spread its focus between several leading teams and Ferrari had all of Bridgestone’s attention.

You’ve got to remember the circumstances in which Mercedes dominated the first few years of the hybrid era, too. It made a big point behind the scenes of getting a head start on its rivals with 2014 rules development on both the chassis and the engine and caught everyone else out.
While teams like Ferrari and Red Bull-Renault were still trying to get on top of both reliability and performance, Mercedes was streaking clear, bringing more upgrades and rounding off its rough edges. It had three years of really clear domination before anyone started getting closer.
It’s worth a look at the least dominant seasons by this measure of win percentage for the constructors’ champions as well.
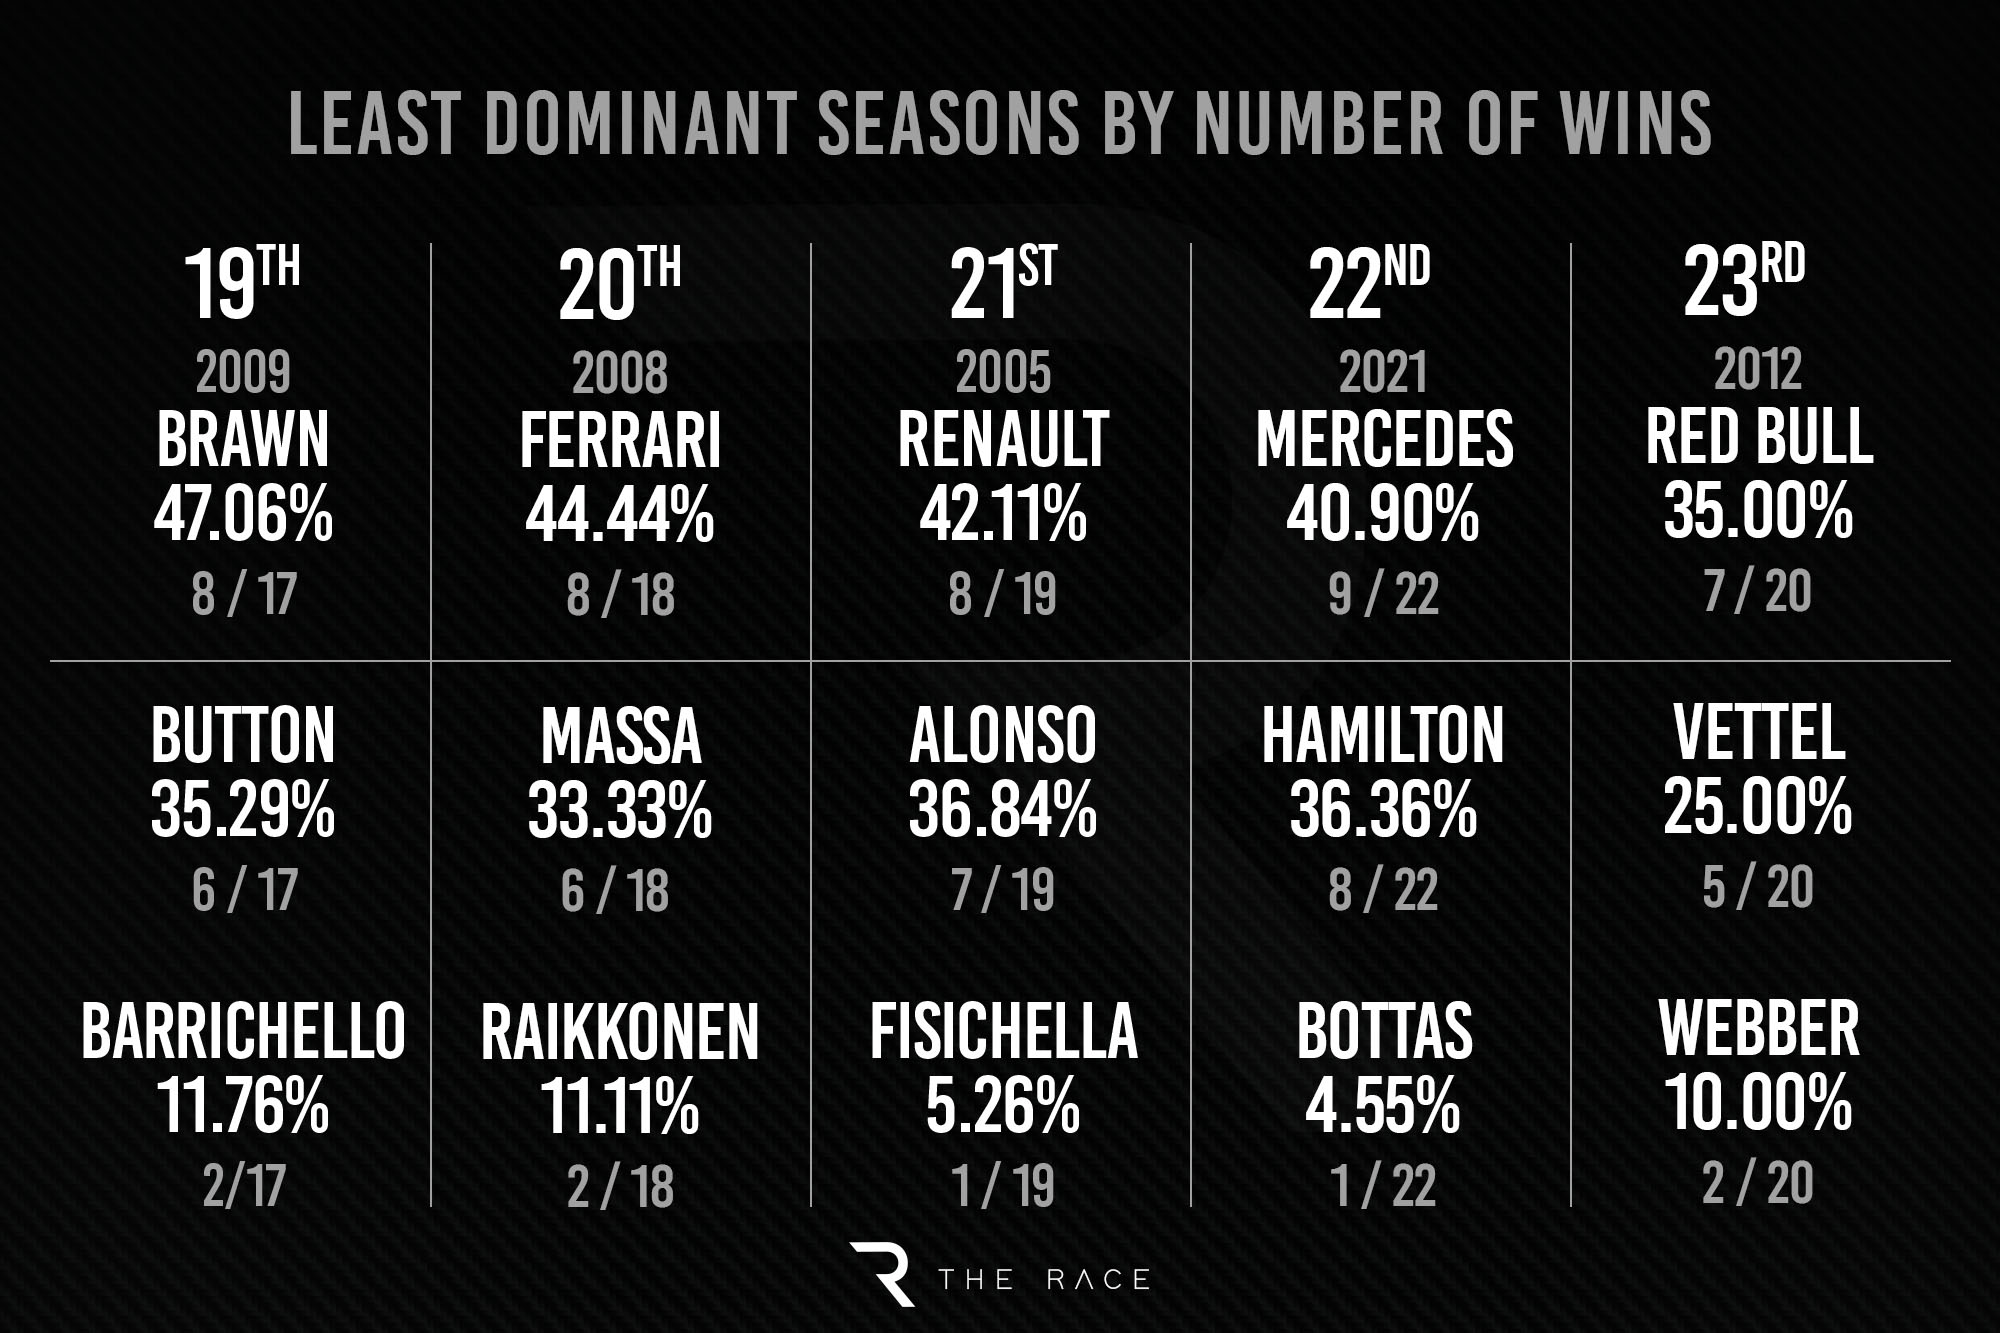
There are a few interesting anomalies there. The 2008 and 2021 seasons were both cases of two teams hitting peak form at the same time and having really close title battles – McLaren vs Ferrari in the first one, Mercedes vs Red Bull in the second. In both cases one team won the constructors’ and the other one won the drivers’. Any one of those cars might have completely dominated a season had it not been unlucky enough that another team got a lot of things right too.
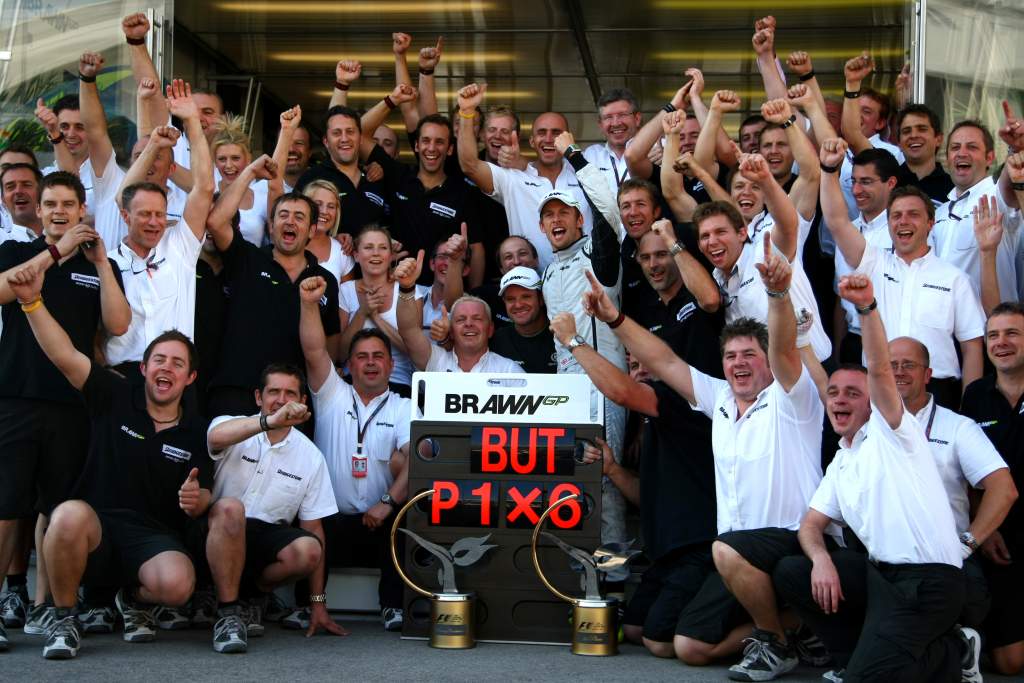
The Brawn year shows that early domination might not mean much. Seven races in, it was on an 86% win percentage, but it only won 20% of the rest of the season. But the circumstances of that year – a team that had put loads of resources into the new rules under its old owner only for that owner to close it down, the new owner not having the resources to then develop it in the same way, and it also coming across a rules loophole (the double diffuser) that most others needed half the season to catch up with – are pretty hard to repeat. Anyone hoping Red Bull might have a Brawn-style tail-off in 2023 is going to be disappointed! And even with that slump, Brawn still won the title.
In 2005, the team with the biggest winning percentage – McLaren, 52.63% victory rate – didn’t win either title, mostly thanks to the poor reliability of its Mercedes engine. More race finishes and fewer grid penalties for Kimi Raikkonen and we might be talking about 2005 as a season of huge McLaren domination, though Fernando Alonso and Renault would’ve still been pretty dogged rivals.
People often think of 2010-13 as total Red Bull domination, but that 2012 statistic shows that’s not totally true. McLaren won as many races as Red Bull that year, yet Ferrari was its actual main title rival and six different teams won grands prix.
That wasn’t so much a case of lots of teams peaking at once, but lots of the main players getting things wrong or maybe in Red Bull’s case you’d say being pegged back. That year Adrian Newey had to handle a load of rule changes affecting blown exhausts, nose flexibility and (just before the season) the placing of bodywork around the exhaust. It took late-season upgrades to unlock all the magic again. So while it wasn’t dominant, that was largely because in 2011 Red Bull had been so dominant the goalposts had to be moved. And a bit like Brawn still getting the 2009 title across the line, it just shows that you only have to be better than your opposition over any given season.
Most dominant drivers
Looking at driver domination, Verstappen holds the record for most wins in the season thanks to the 15 he took last year, but he had 22 races to achieve that in. Convert it to a percentage (68.18%) and Schumacher’s still on top here – as the table below shows. To beat that mark, Verstappen needs 17 wins from 23 races in 2023 as that would be a 73.91% rate.
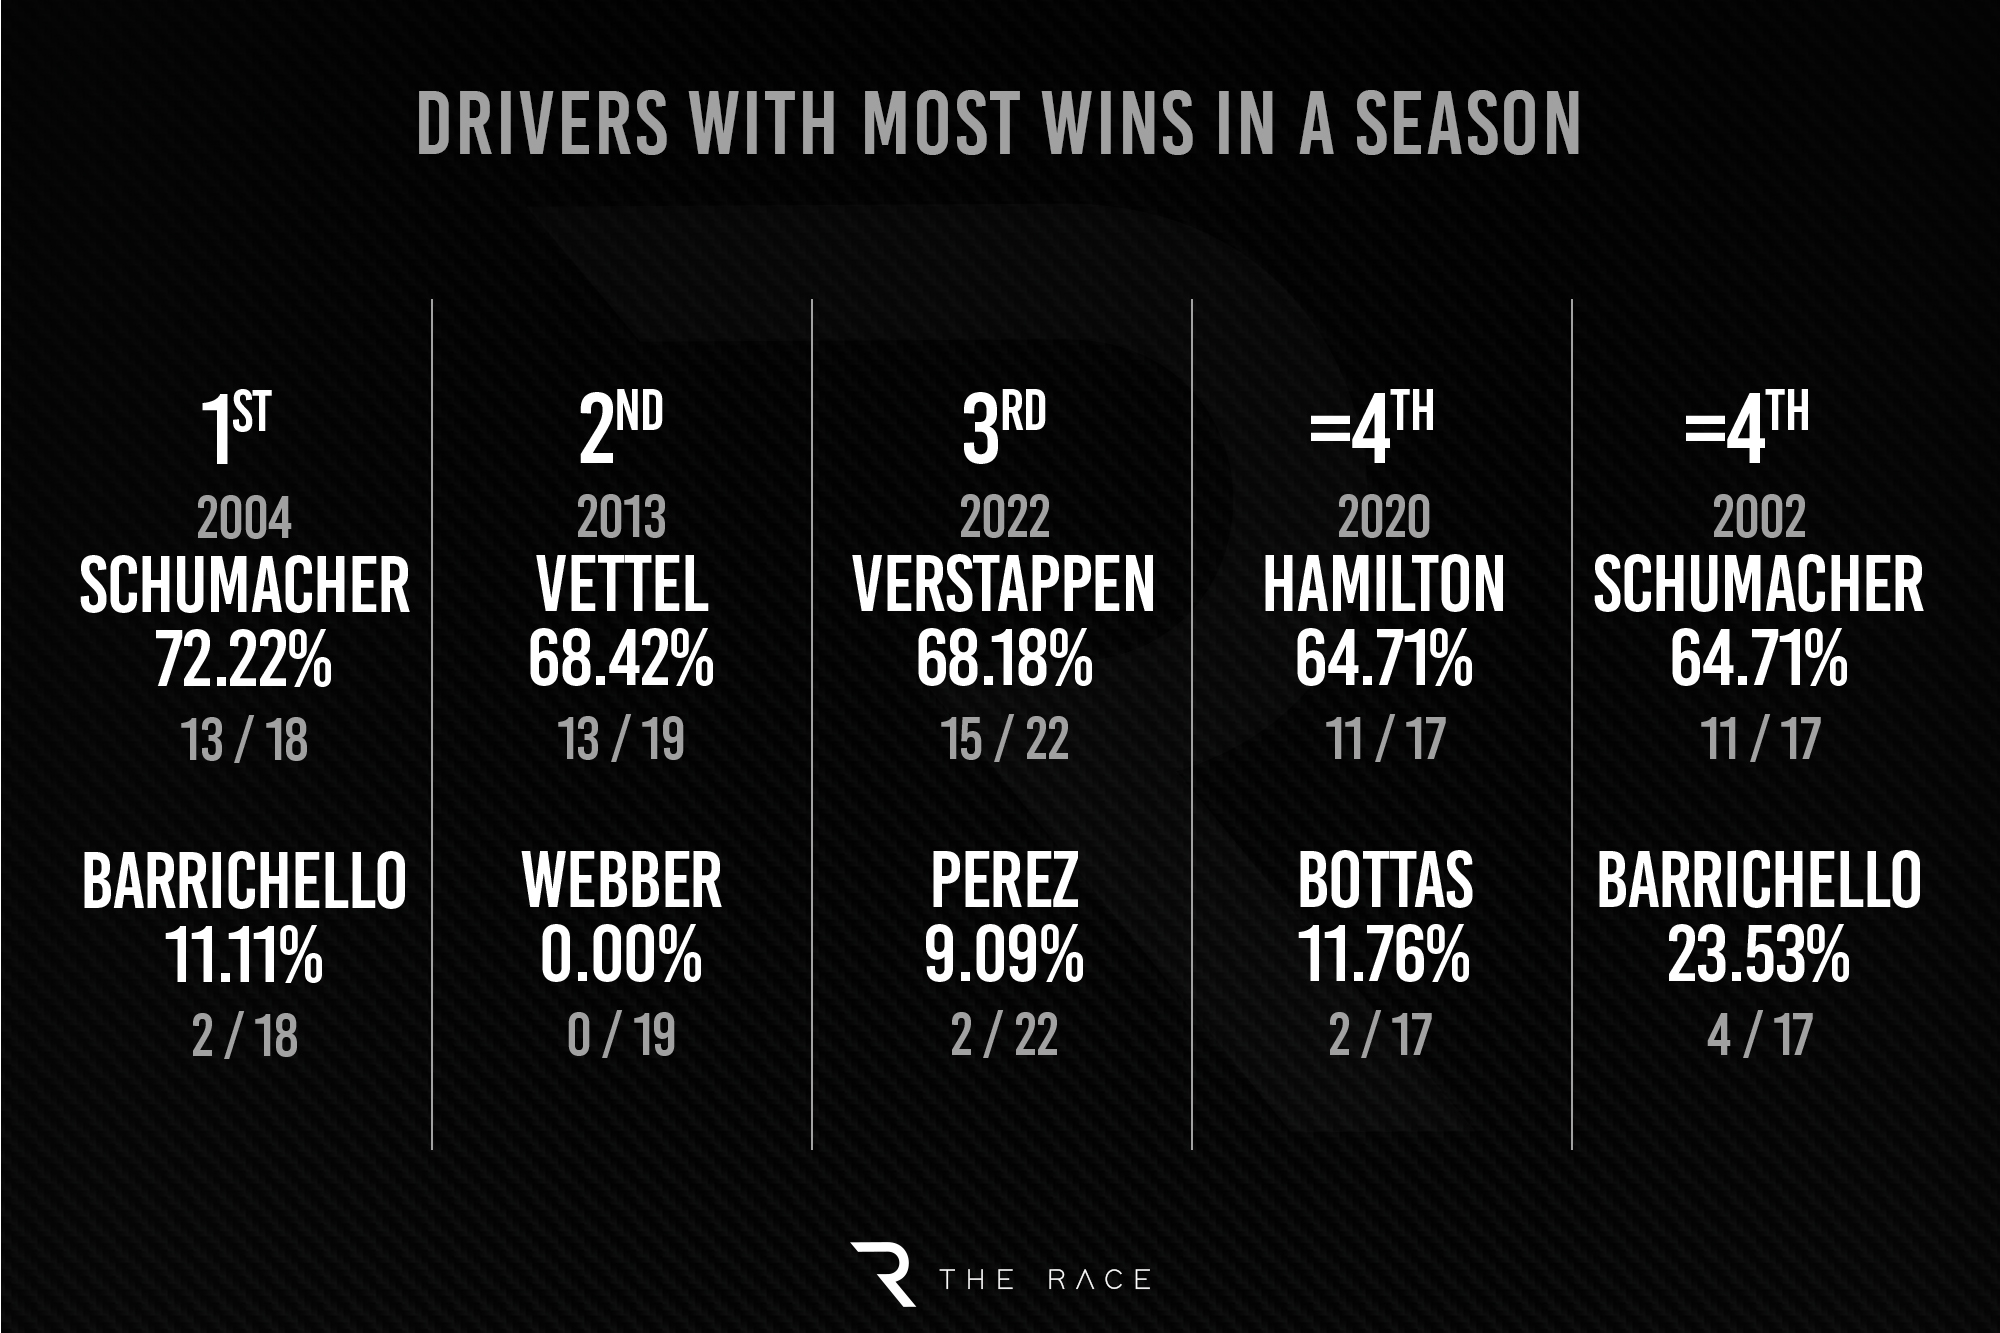
I’ve included their team-mates too to show how those drivers compared to the person with the same equipment, and for Schumacher the numbers really say it all. Barrichello is no slouch and Schumacher blew him away, as Vettel did with Mark Webber in 2013. That was the year of biggest difference between Vettel and Webber – partly through Webber tailing off before retiring but mainly because it was the season when Vettel’s driving style to make use of the blown-exhaust effect in slow corners was most important to Red Bull’s pace advantage and he had far more of a knack for that technique than Webber.
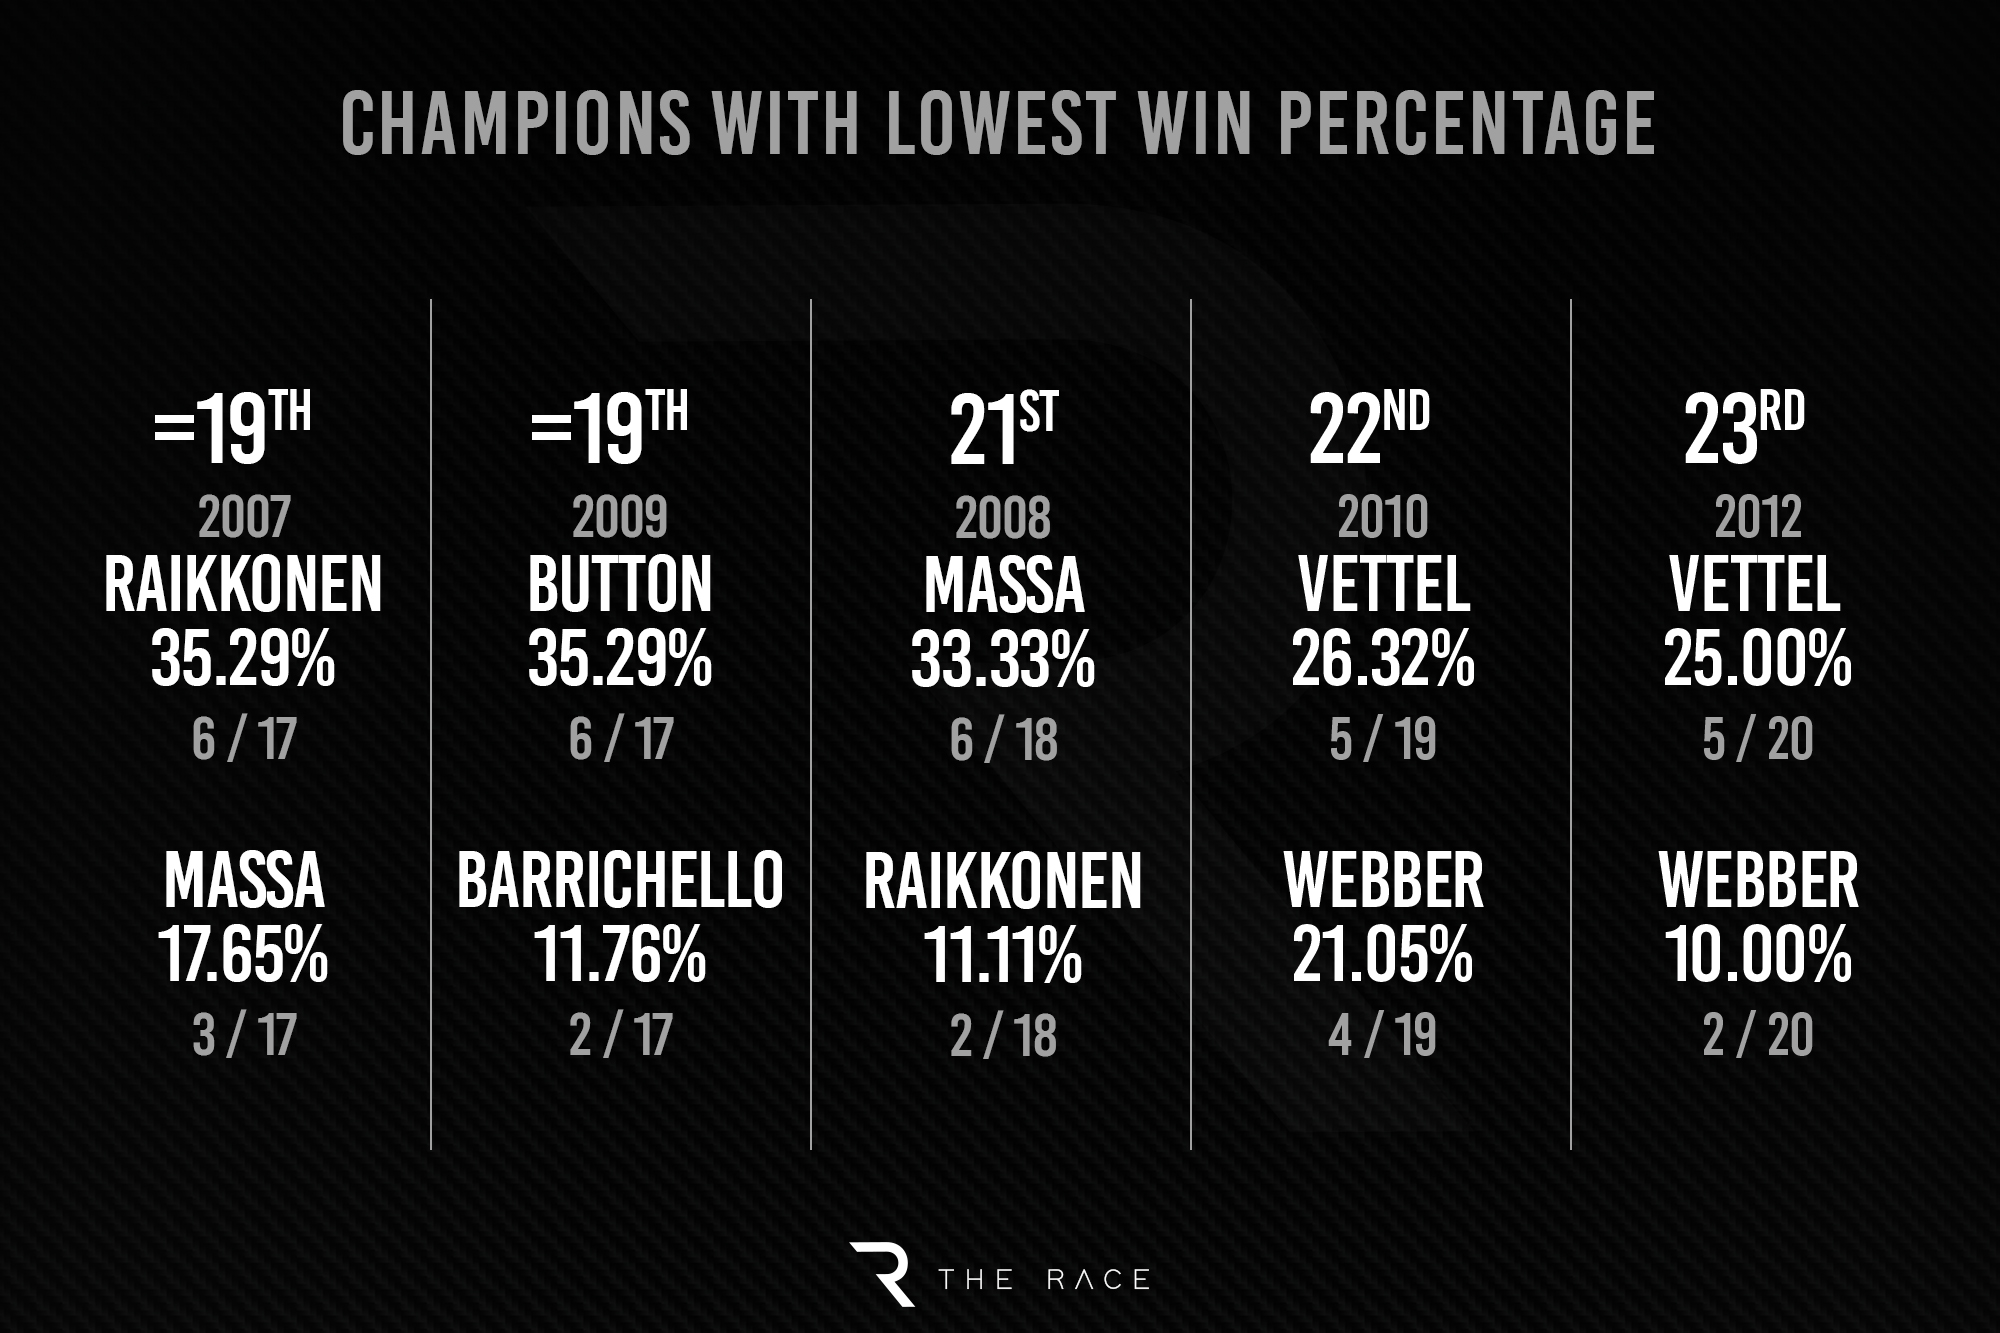
It’s worth a look at the bottom of the list again too at the champion drivers with the lowest win percentage. It’s the same story of a few very strange seasons like 2009 and 2012 (and 2010 was a multiple-team fight too), plus two very close ones in the 2007 and 2008 Ferrari/McLaren battles.
Maximising your score
Wins are just one measure of domination of course. I’ve also had a look at the percentage of the maximum possible score for a single team that each constructors’ champion team took. This is a good way to measure how they executed the races as the second driver’s scores play into it too, as does reliability.
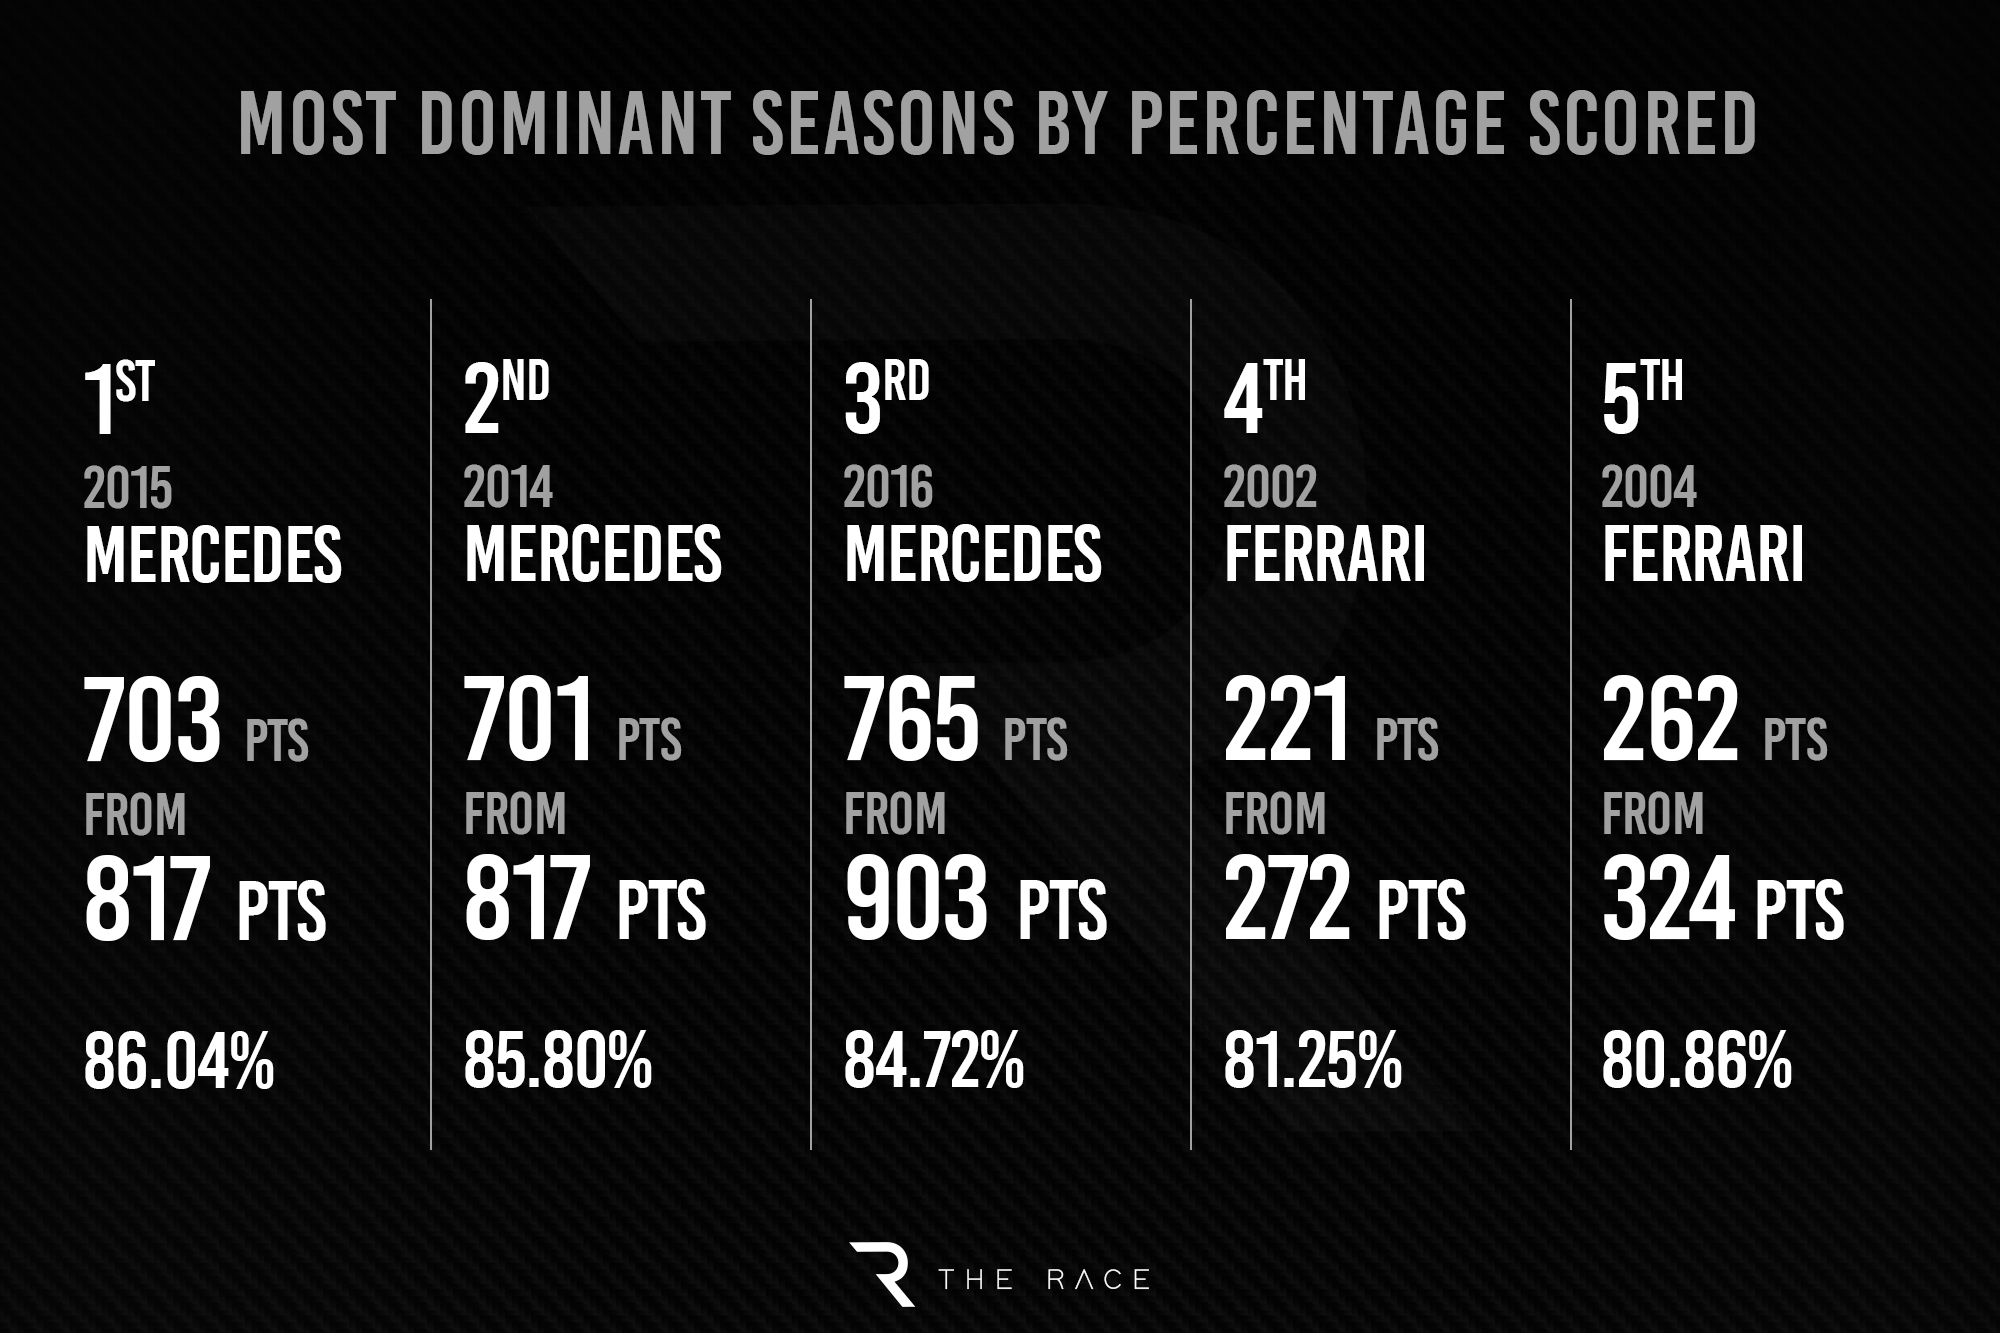
Mercedes in the early hybrid era nailed it – three very dominant seasons there, which the Brixworth power unit manufacturing department deserves a fair bit of credit for.
It was engine performance and reliability that really set Mercedes apart in those years before the others got their acts together and closed in and it became just that bit more difficult. But 11 one-two finishes in the first year of the new rules in 2014 and 12 the following year speaks volumes.
Red Bull’s 2022 season is 10th on this list, with a 74.9% score. Across this year’s 23-race calendar with six sprints and fastest lap bonuses in the grands prix too, the maximum possible score is 1102.
Red Bull’s definitely not going to get 100% of that as it didn’t get fastest lap in Bahrain! It needs 949 points to beat Mercedes’ 2015 achievement of an 86% score, and last year it ‘only’ took 759. Even with an extra grand prix and more sprints this year, that shows just how firmly Mercedes shut the competition out in 2015 and the surrounding years.
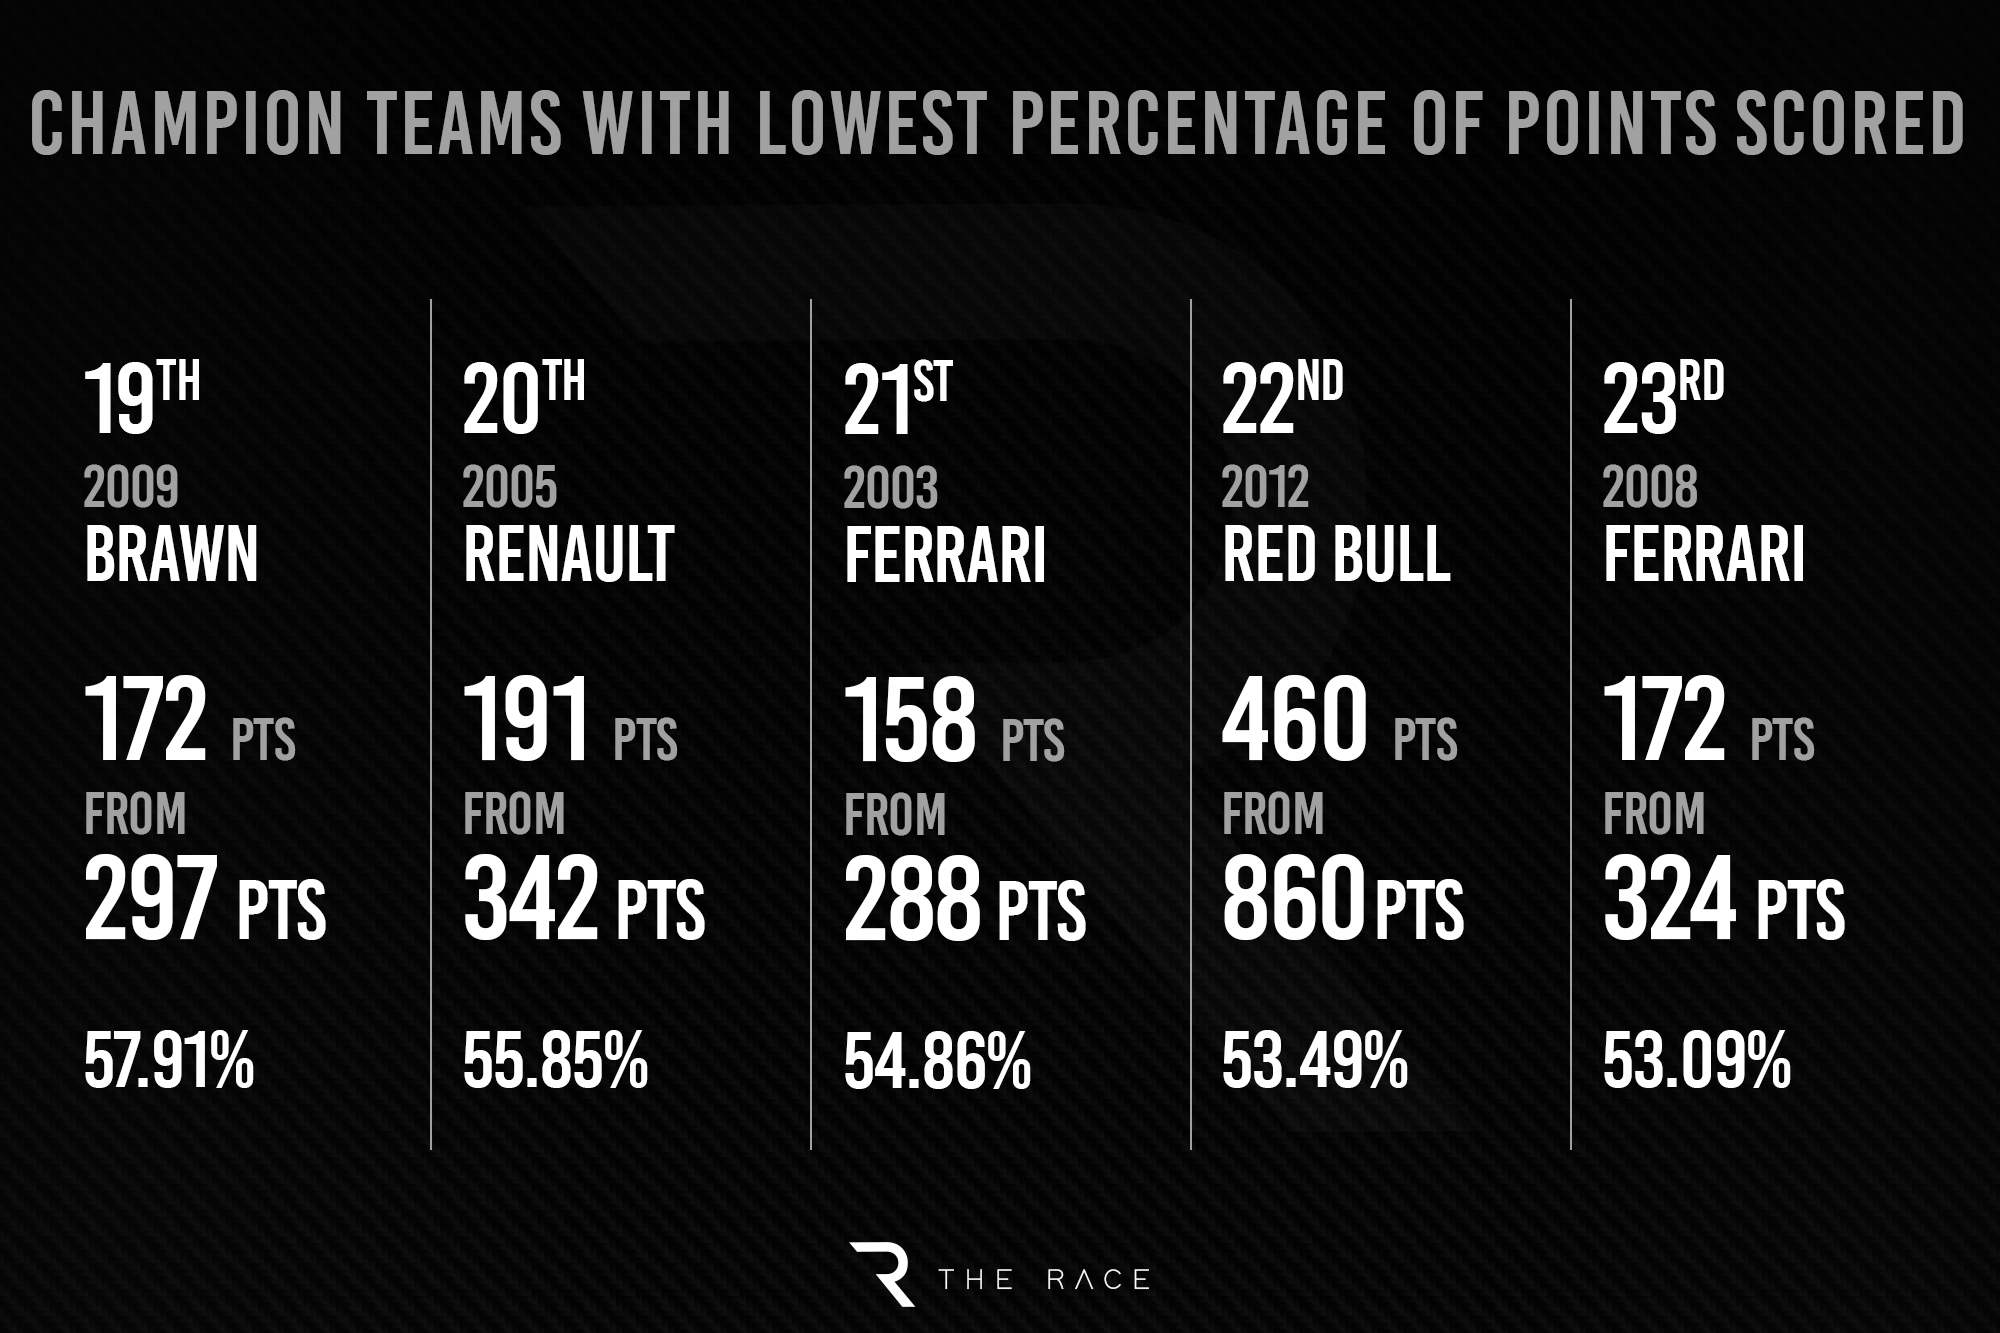
There are some familiar seasons in the bottom five again, underlining my point that dominating is great but really all you’ve got to do is just do better than anyone else.
The 2003 season is an interesting addition to the bottom group. I mentioned Ferrari benefiting from its relationship with Bridgestone but when F1’s format changed and everyone had to qualify on race fuel in 2003 Michelin often had the edge. That was the main reason for a much more open season in which McLaren and Williams were able to fight for the title and Schumacher had the narrowest title win of his Ferrari championship years. A bit like Red Bull’s 2012, Ferrari’s 2003 was in a period people think of as just part of a long run of dominant years but it really wasn’t – and that was much more because of the rulemakers than anything the champion team did wrong.
I’m pretty sure most would say those least dominant seasons were the more interesting ones as the competition was tougher. For me and I’m pretty sure many other enthusiasts and viewers, that’s what we want. Yes, if you really support a team you want it to do well and might enjoy watching it win 20 races in a year, but I would rather see it win by battling rather than win by domination.
Margins over the competition
Thinking about that theme of which seasons were best and worst for competition, I’ve taken the team that won the championship and the percentage of the maximum points it scored, and added the same metric for the team that was second in the championship.
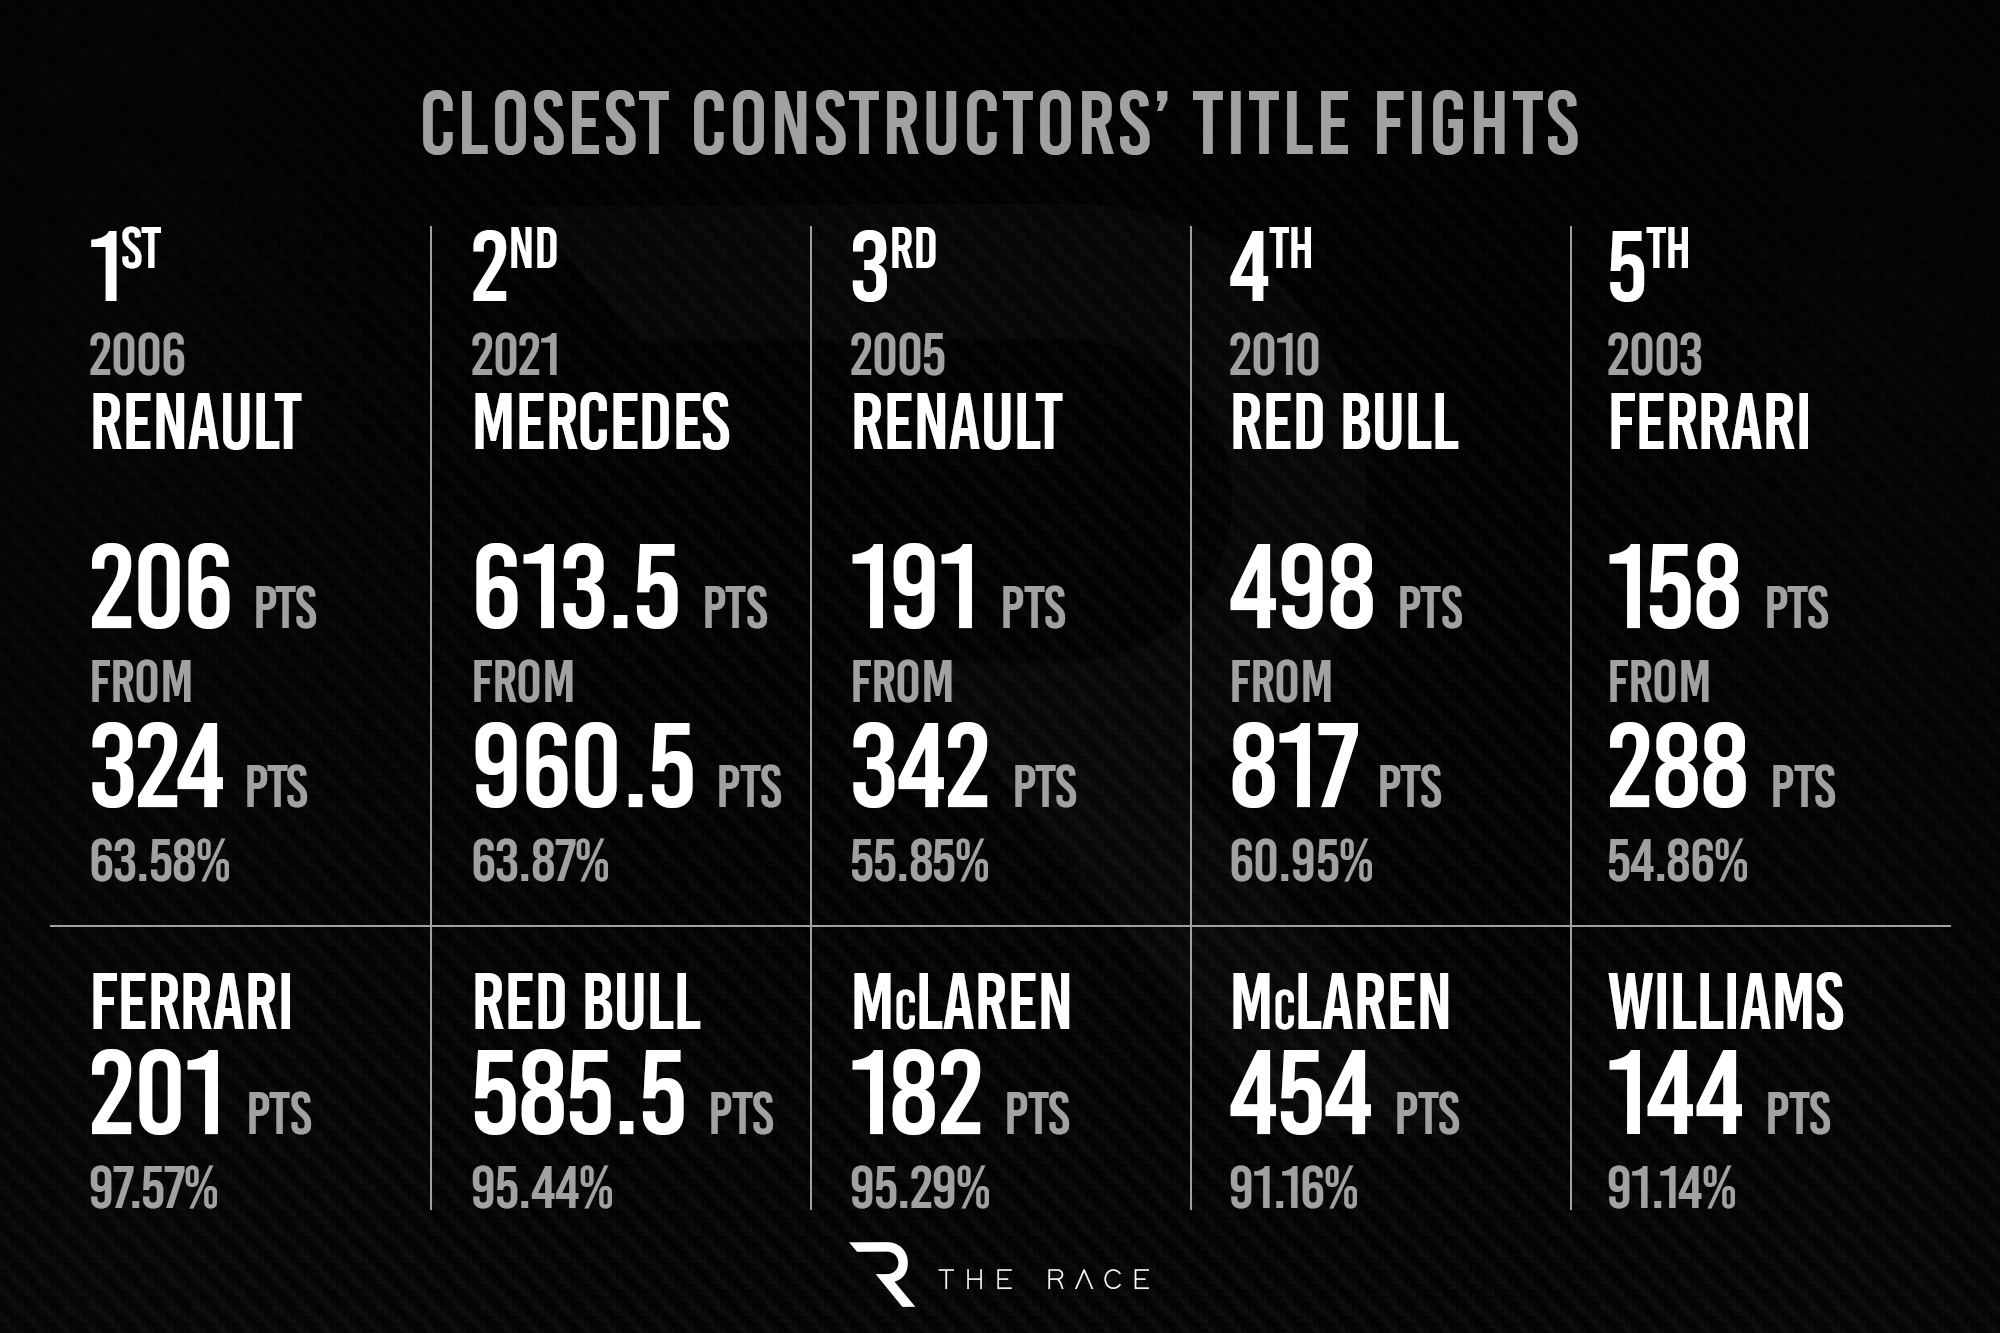
And the bottom five to show the least competitive seasons.
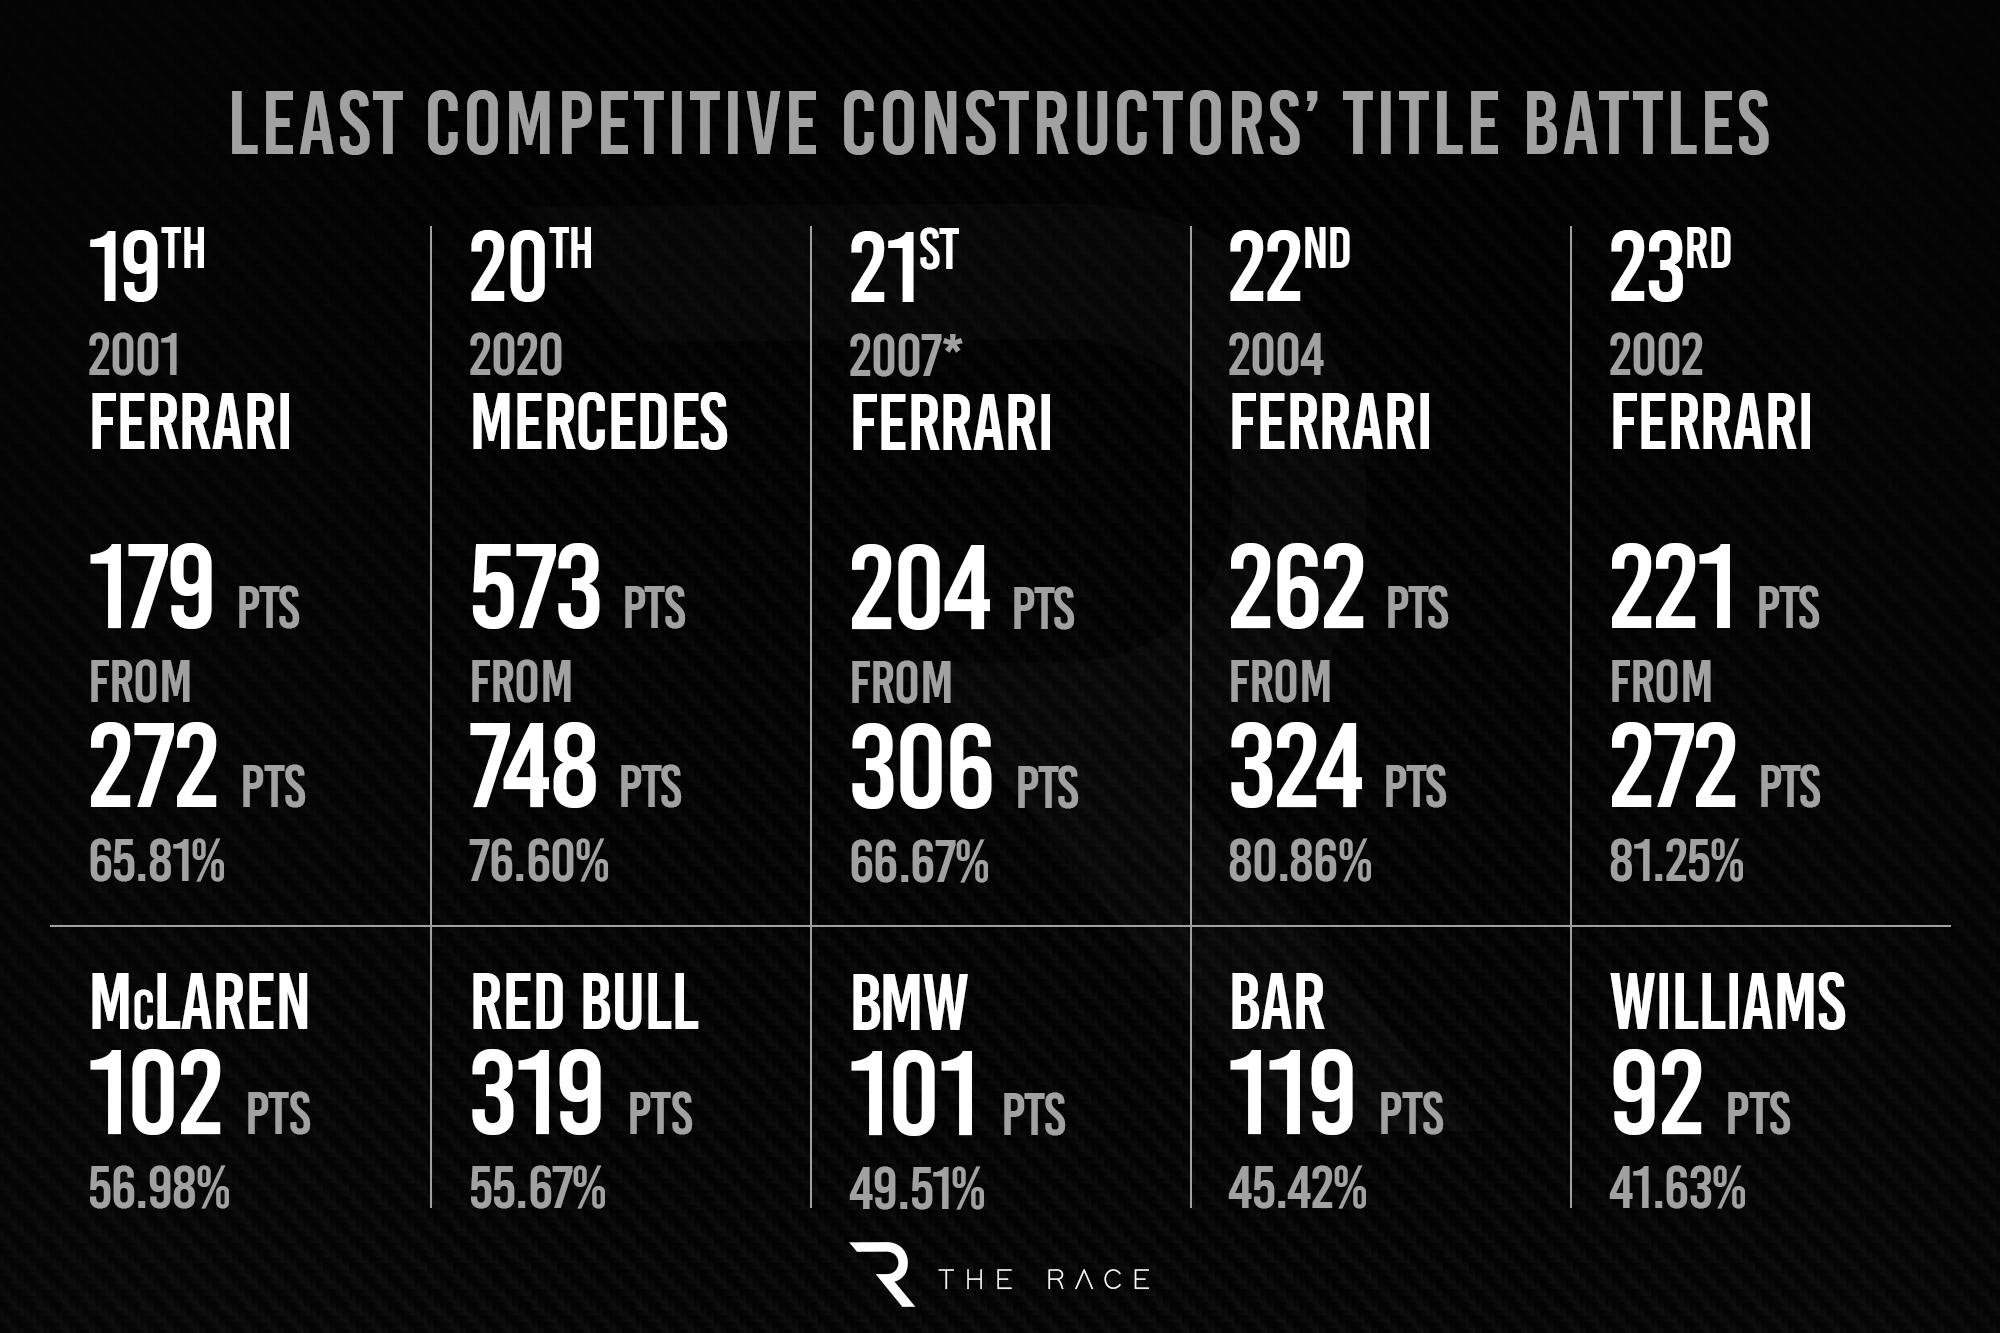
There’s a big anomaly in these tables that I should highlight: 2007. That’s when McLaren had all its constructors’ championship points taken away as part of its punishment for the Ferrari spying affair. So Ferrari’s big gap over BMW Sauber may be what the official records state, but it’s not the real story of the season.
Ferrari vs BMW wouldn’t have been a very competitive championship, even though BMW had a pretty decent year. Give McLaren all its points back (including the 15 it was barred from scoring in Hungary as a separate penalty for Fernando Alonso and Hamilton’s qualifying blocking) and it would’ve won that year’s constructors’ title by 218 points to Ferrari’s 204, but Ferrari having 93.6% of McLaren’s points would make that year the fourth most competitive of the century so far by this category rather than it being down in 21st. Or if you factor in the Hungary penalty, Ferrari wins by one point and McLaren has 99.51% of its points – making this the most competitive of them all. But as McLaren wasn’t allowed to score constructors’ points after mid-September that year, it’s all hypothetical.
The other standouts in the two tables that haven’t cropped up much so far are 2006 – our most competitive season by this measure – and 2020, which perhaps surprisingly ends up the most dominant Mercedes season by this measure.
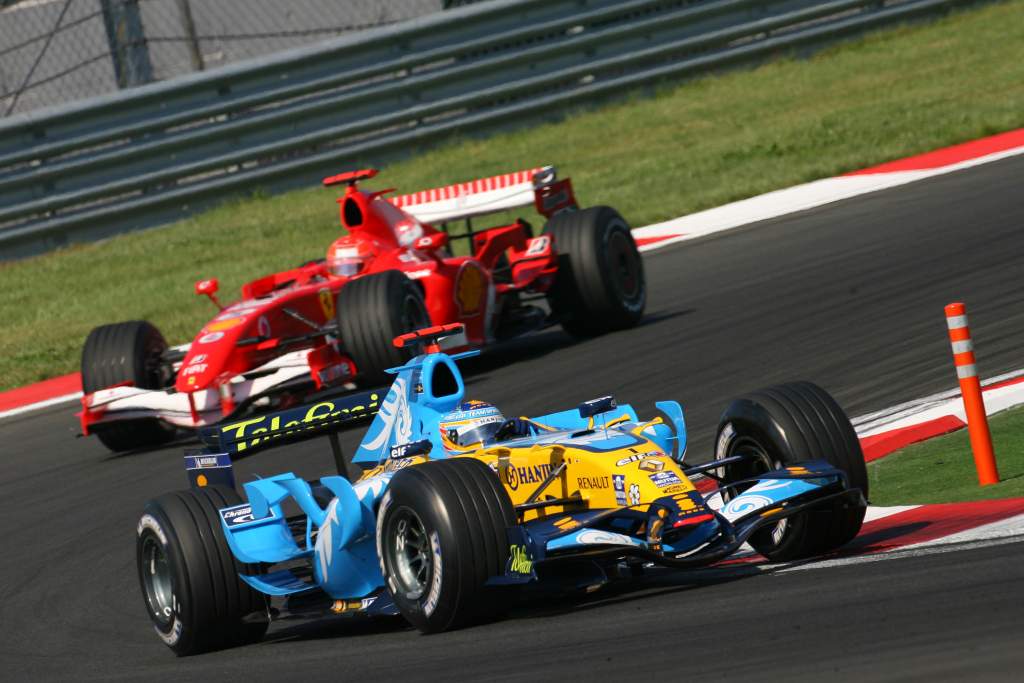
With Renault and Ferrari both on top form and the advantage between them swinging with the performances of their tyre suppliers Michelin and Bridgestone, it’s no surprise that neither could dominate 2006 and it goes down as a really competitive year in the stats.
As for Mercedes’ 2020 season, the fact this ended up as its biggest margin of constructors’ championship victory in percentage terms even though by all other measures it wasn’t as dominant as across 2014-16 is actually down to a particular fact about the opposition.

Its closest championship rival Red Bull had an unbalanced driver line-up that year as Alex Albon struggled alongside Verstappen, and though they still did enough together to get second in the championship, it meant the percentage gap was bigger than Mercedes had over Vettel/Daniel Ricciardo/Red Bull in 2014 and Vettel/Kimi Raikkonen/Ferrari in 2015-16.
All this shows just how many ways there are at looking and measuring domination, and this has just been from results and championship statistics without even getting into supertimes and performance gaps, and how many factors could potentially create domination – or undermine it.
From the first two races of 2023, it certainly looks like Red Bull has continued where it left off at the end of 2022. It is the second season of these new aerodynamic regulations that it’s mastered better than anyone else so far and together with a more diligent approach to the policing of the financial cost cap limitations it will be interesting to see where this season pops up on my lists in the future. Right now, it feels like it will be pretty high up in the dominance stakes unless anyone else can show that it’s still possible to really recover from a bad start and change the form book.